MultiRepMacsChIPSeq - Overview
| Home | Overview | Usage | Variations | Examples | Applications | Install |
Overview

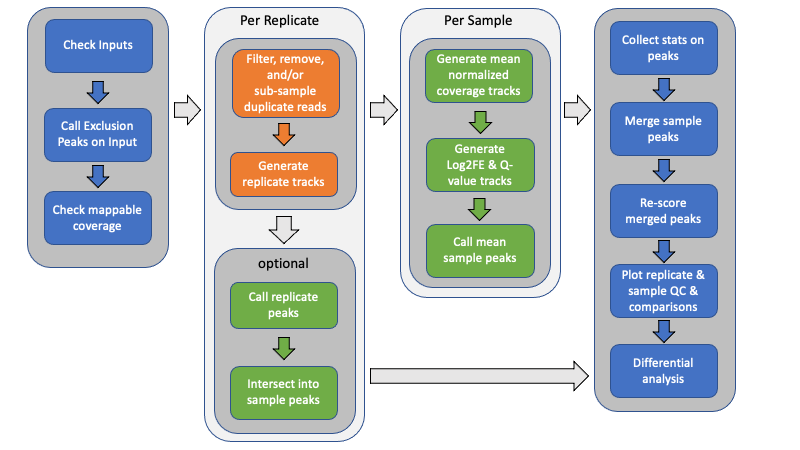
Above is a graphical overview of the pipeline. Below is a description of the steps. Here, samples are used to mean separate experimental conditions (antibody, treatment, genetic status, time point, whatever), while replicates are used to indicate one or more biological samples (animals, culture, etc) of the same condition. Technical replicates could also be included.
-
Generate exclusion list
Unless provided with an exclusion (black) list, an empirically-derived exclusion list is automatically generated from the Control reference files by combining all of the control files (without deduplication) and calling peaks. Exclusion lists are critical to removing potential false positives and removing a large source of duplicate alignments.
-
Calculate mappable size
Unless provided with an explicit, effective genome size, the effective mappable size is calculated empirically from all provided alignment files using report_mappable_space. Having an accurate, experiment-based genome size should provide a more accurate statistical estimation of peak enrichment.
-
Filter alignments
Alignment files may be filtered for a variety of reasons, including overlapping exclusion intervals, unwanted chromosomes (mitochondrial, alternate haplotypes, unmapped contigs, and/or decoy sequences), duplicate alignments (optical or PCR-derived), secondary and supplemental alignments, and mapping quality.
An optional step can include sub-sampling PCR-duplicates to a consistent level. See the De-Duplication Evaluation for further details.
-
Generate replicate count tracks
To facilitate generating count matrices later, point-data count bigWig files, either shifted start positions (single-end) or fragment midpoints (paired-end), are generated using bam2wig for each sample replicate. By default, replicates are depth-normalized and scaled to the same target depth (by default the median observed depth of all provided Bam files).
When independent replicate peaks are called too, fragment coverage tracks for each replicate are also generated.
-
Independent-replicate peak calls
When indicated, independent peak calls may optionally be generated for each replicate using Macs2. These replicate peaks are then intersected to generate a consensus peak call set for the sample using intersect_peaks. By default, consensus peaks must be identified from a minimum of two replicates (when available).
-
Generate replicate-mean fragment coverage and enrichment files
Generate per-sample mean fragment coverage for both ChIP and corresponding reference control using bam2wig. This averages sample replicates in a depth-normalized manner, ensuring that all replicates have the same weight when making peak calls.
Macs2 is used to generate q-value and Log2 Fold Enrichment tracks from the mean-replicate ChIP fragment coverage and lambda control files for each sample.
-
Call peaks
Use Macs2 to call peaks from the mean-replicate q-value tracks for each sample separately using the indicated threshold, minimum peak size, and peak gap size for merging. The peak call parameters can be explicitly specified for custom control. Broad, or gapped-peak, calls may also be made if desired.
-
Intersect peaks
Use intersect_peaks to intersect the peaks from each ChIP sample into a master list of peaks across all ChIP conditions, as well as generate a variety of statistics regarding the peaks and their overlap. This is done for both mean-replicate and independent-replicate samples. These statistics are plotted as QC plots by plot_peak_figures.
-
Rescore merged peaks
Use get_datasets to generate matrices of log2 Fold Enrichment scores, q-value scores, coverage, and count data for the merged list of peaks. Also, use get_relative_data to collect the profile of plots using both fragment coverage and log2 Fold Enrichment scores around the peak summit or midpoint.
-
Plot replicate and sample QC and heat maps
A variety of replicate and sample QC plots, correlation plots (Euclidean distance, PCA, Pearson, and Spearman), intersection (UpSet plots, count and spatial-overlap intersection heat maps), and occupancy and enrichment heat maps and line plots are generated using a custom R script, plot_peak_figures.
-
Generate report
Generate a Markdown report that summarizes the pipeline options, alignment statistics, and peak call numbers, intersections, correlations, and results. Includes a select number of plots to illustrate the report. If Pandoc is available, the Markdown report will automatically be converted to a self-contained HTML report.
-
Differential analysis
The merged peaks may then be evaluated for differential occupancy between two or more samples using rigorous statistical analysis. For example, DESeq2 may be used to identify significantly different peaks. Some basic R scripts are included to perform such analysis on an ad hoc basis.